map

Monday 22 February 2016

Berlin: what the tea dragon said about the friendship-phobia

If you are one of those extroverts who never had issues with friends and friendships and never had a mythical creature as a buddy, there is not much more for you in this post than the pictures (all not matching styles). Otherwise, you may also want to meet the tea dragon.

You meet him through a cup of properly brewed Oolong. First comes the warmth, then the smell, then the taste. Before the tea is over, the steam takes the shape of a baby-dragon, then it grows fast to swallow the entire room. This is the time to unleash the heartware and talk. To the dragon, to your mates, to yourself.

A photo posted by Elizaveta Semenova (@farbless) on

And so we did with my friends at their place in the German capital. We spoke with the tea dragon heart-to-heart. Coincidentally, that was St. Valentine's. There was so much love in the air, that even old political leaders were kissing (Captured on the picture below. Maybe they do so frequently, but I did not see them on any other day). Therefore, it was the perfect moment to theorize about friendships and other -ships.

A photo posted by Elizaveta Semenova (@farbless) on
The dragon said, it was natural for people in your life to come and go. He said, making friends sometimes required pushing oneself out of the comfort zone - stepping out of the corner, saying a 'hi' first and lifting the edges of your lips; keeping friends took effort - calls, messages, thoughts, any sort of connection; spending time with friends needed planning, negotiation and time itself. The dragon spelled out, that the reward was high because friends made your family of choice. If one didn't have capacity to support their -ships, this was a choice too.

I have a theory about friendship-phobia. Individuals with this condition
1. intentionally do not behave friendly,
2. avoid contacts with old friends,
3. do not respond messages for years even if they sometimes dream of how nice it could be to re-connect,
4. do not talk when they meet someone, only listen and walk by their side,
5. can only spend time together in a structured way when the roles are clear.

While making my experiences in Berlin outside of the house I couldn't stop contemplating -ships and -phobias. The peculiar slicing of places, atmospheres and folks within a very short time were bizarre but very comforting and representative of my social preferences.

A photo posted by Elizaveta Semenova (@farbless) on

I touch a warm clay tea cup and hear the dragon (yes, they also know how to count):

1. make friends,
2. keep friends,
3. spend time together,

or chose not to.

Sincerely yours frienship-phob,
enjoy the pictures!

Wednesday 10 February 2016

The leaking pipeline of the faultless gender

Once a year our university offers female PhD candidates and postdocs the opportunity to participate in a mentorship program called Antelope. It has two branches - Antelope at university and Antelope at Novartis, addressed to those willing to pursue academic and industrial paths respectively. The objective is to support young lady-scientists obtain a better picture of  their future career possibilities and help them shape a strategy towards the desired role through a series of workshops and mentor-mentee activities. Over-arched, this is the university's and corporation's infusion into the ongoing fight for gender equality.

The echo of this program reached me several times through female friends who took part in it in the past years. From their feedback I understood, that many of them could benefit from being mentored to different degrees while almost everyone was praising workshops where they met and mingled with other co-antelopes. Thinking of myself as someone with reduced social potential, never would I think of that second part as something attractive. My goal of joining the program was to use its means to learn more about the role of statistics and machine learning in the pharma industry, to ask to which extent they are able to use artificial intelligence and what is the prospective, how much impact can one have working in that field and whether some freedom is permitted or one becomes a prisoner of the golden cage... How big was the surprise, when after having applied and being accepted, I found myself on the first event engaged into the group work and attentively listening to other people's life stories!

After a formal introduction, we jumped directly into the career planning workshop. Since we had to present ourselves by outlining our backgrounds and previous paths, the conversation slipped into the personal plane pretty soon. The ambient created in the circle of humans with highly similar life situations was comforting: female, permeating scientific thinking, feeling being financially undervalued by society, experiencing obstacles in their programs - through mobbing, unsuccessful experiments, lack of materials or funding, difficult advisers, lack of future perspectives - all of that boiled up into the state where nearly everyone was upset about their projects for one or another reason and an overwhelming feeling of insecurity. Both in professional and personal lives. 


Still, at this point I kept questioning whether there was something special about the audience of the room compared to the rest of the PhD and postdoc population. The obvious answer was gender. But what does this unfold into?


For a long period in the past I stayed very skeptical towards all gender specific issues in the 'first world'. 'How are we going to achieve equality by keeping the frontier so sharp? How can we unite by underlying the separation?', - I was wondering. Somehow, over time this attitude ceased as I informed myself better about the so called 'leaking pipeline'.


'The leaking pipeline' is a phenomenon when high number of women leave academic careers after the PhD stage making the counts of male and female scientists on further levels uneven. The same applies to industrial leadership positions. At a first glance one may think that there are simply more women who prefer staying in the work force or being housewives compared to roles with power, social and business involvement. But we will never know the answer until the mentality of our society is such, that it allows us to run that experiment collectively. And count the numbers a posteriori. 


Now back to the workshop room where we, confused girls, are putting bits and pieces together to understand how a perfect career for each of us looks like. One of the exercises we have to do is to select the values, that we prioritize at the moment. We are given a list of pairs like 'Influence-Justice' and from each pair we have to select just one. These preferences build new pairs, and so on until only three values are left. We write them on colorful cards and put them on the floor to have an overlook. Most frequent outcomes are Meaning, Challenge, Independence, Fun - very representative for our social group. 'No trace of power, status or relative features, like it often occurs in male and/or industrial groups. No harmony and aesthetics, that so many females would seek.' - our coach notices. I couldn't fully relate to the last assertion since I sometimes physically suffer when colors in a space or on a person opposing me don't feel harmonious. But overall, this is a very precise portrait of the material that is about to 'leak', including myself at some point in the future. It doesn't really sound that we carve for high positions, power and respect. Who cares for the outlook when it is only the content that matters - what do you really know? what are you able to do? how do you leverage hard tasks? If you perform well at those, all rewards are yours - one may think naively. Anyhow, there is one hidden obstacle in this story. It is called resources. Any task is performed better, or has potential to be performed better, when better resources are available. And most of those resources are concentrated in the hands of men, who, not because they are bad, but because they are different, may be overlooking some issues, crucial to the lives of women.


The day was closed by a talk of a female professor. She communicated a clear message about the currently existing inequality between genders at work. Her style, though, was witty but provoking. Some of her arguments sounded sexist. She proudly told us stories of how she made some men, whose ego she considered over-pumped, feel bad.

My eyes became big: oh really? Is this how we are approaching the problem? Putting someone else down won't help us rise! The saddest thing was that most of the girls kept knocking their heads in agreement or giggling. What an evil strategy she picked - playing on other people's insecurities and presenting women almost faultless compared to men. Trying to understand my feelings and reactions while listening to her, in defence of integrity, I hurried up to formulate my own position: 'Don't be faultless. Be conscious and proactive'.

At the end of the speech she mentioned a book, that was advised to me recently by Odette, whom I accidentally met through a friend and found very pleasant. That friend, Jenn, who is an amazing woman herself, dares to be all in one: passionate about her job, a caring mother and wife, a wise open person. Having those examples in front of my eyes substitutes all the talks of the world about how it may and should be... in theory.

The aforementioned book is 'Lean In' by Sheryl Sandberg - a curious reading-matter supported with facts and stories. The content of the book is summarized by Sheryl herself in the TED-talk posted below (even, the book is dated later than the video).

These were my reflections after just the first Antelope 2016 event. Looking forward for more.


Sunday 7 February 2016

How cursed is the curse of dimensionality? Simply explained.

Why does an alien look for neighbours longer than an earthling? This post explains!.

"The curse of dimensionality" is a jargon expression originating from statistical and machine learning. It refers to the issue of a drastic increase of the volume of the boundary layer as compared to the volume of the interior of a unit cube or a sphere as dimension grows.

An example: imagine, you are a climate data scientist and want to track the ice coverage of a remote mountain over time. The mountain is not just very far, but also very steep. Traveling would exhaust your budget, not to mention that you would have to be a professional climber to be able to get to the top to perform a measurement. Repeatedly.

Compared to that hard way, you could find a lot of ease in simply downloading satellite data with an image of the region of your interest. But also here pitfalls await: even if you consider yourself a lucky person, it is almost unavoidable, that some of the pixels contain no information. This may happen, for instance, due to the clouds hovering over the 'blind' point at the time when the image was captured.

What to do? Common sense is prompting, that if most of the points around the 'blind' point are covered with snow, it is likely that this point will lie under snow too. And vice versa: if most of the points around (k closest representatives) display a naked rock, we would believe, that the 'blind' point is a rocky surface as well.

At this stage we would instruct our data-imputing algorithm to go and find k nearest points and 'interview' them for their values. The value that they collectively vote for should be accepted. This procedure is called the k-nearest neighbours (KNN) classification.

How far would the algorithm need to wander until it discovers all the k interviewees? Our hope is that the space exploration would not take it too far, i.e. it will not have to reach the boundary... otherwise it may fall of the cliff :) By the boundary we mean 10% of the most extreme values on each axis.

If our entire space was a unit cube, in dimension 1 the main exploration space (the interior) would be a segment (0.05, 0.95) with volume 0.9, and the boundary would have volume 1-0.9 = 0.1. In dimension 2 the boundary would look as the space enclosed in-between two concentric squares. The volume of the interior is now (0.9)^2. Hence, the volume of the boundary is 1-(0.9)^2 = 0.19. The boundary now is almost twice as large as in dimension 1.

Following this logic, one concludes, that in dimension 100 the volume of the boundary constitutes 1-(0.9)^100 = 0.9999734, i.e. the boundary takes almost all of the space. Which means, if you forbid your algorithms to wander too close to the 'cliff', there will be almost nowhere to go.

Fortunately, your satellite image is two dimensional and, you might think, it is nice to be aware of the dimensionality issues in oder to feel empathic towards an alien living on a 100-dimensional planet with its 100-dimensional mountains.

Yes and no. The trap is that even on Earth we run into high-dimensionality troubles sooner than we expect...

This time imagine, you are a Big Data analyst with Zetabites of data in your pocket. In an urge of explaining an outcome by all possible factors that are available to you, you still would like to forbid the outliers - extreme values in the boundary layer... Do you see where it is going?...

Now a bit of play-around: to better train your empathy to the 100-dimensional alien, here is a code in R programming language that computes the volume of the boundary in dimensionality d using the Monte Carlo method. The plot below the code displays the dependency between dimensionality and the boundary volume.

#this function return approximate volume of a 
#d-dimensional boundary of a unit cube
#n-number of throws for the Monte Carlo method
boundary_volume <- function(n,d){
  #generate n d-dimensional random vectors
  throws <- data.frame(matrix(runif(n*d), nrow = n, ncol = d))
  count <-0
  for (i in 1:n){ 
    #test all generated points on belonging to the boundary
    if (min(throws[i,])<0.05 || max(throws[i,])>0.95) 
      count <- count+1
  }
  #compare numerical and theoretical values
  print(paste('d=',d,': Numerical = ', format(count/n*100, digits=3), '%, Theoretical=', format((1-(0.9)^d)*100, digits=3), '%;',sep=''))
  #return the answer as percentage
  return (count/n*100)
}

n <- 10000
volume <- rep(NA,20)
for (d in 1:20){
  print(paste('d=',d,': Elapsed time = ', format(system.time(volume[d] <- boundary_volume(n,d))[3], digits=4),sep=''))
}

plot(volume, type = 'b',col = "red", xlab = 'Dimension', ylab= 'Boundary volume,%')

Friday 5 February 2016

Google maps JavaScript API on Blogger

As promised in the previous post, here is a walk-through that will help you add a Google Map to your Blogger page.

Since we are going to use Google Maps JavaScript API, you will probably feel more comfortable if you are somehow familiar with HTML and/or JavaScript. But if not, there will be no stress either - just perform all the copy-pastes at your best and it should work.

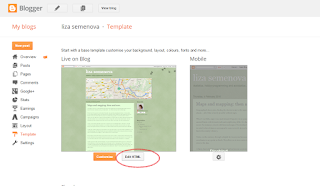
Step Uno). In the 'Design' mode opt for 'Template'


Step Due). Choose 'Edit HTML':


Step Tre). Find the </head> - tag and insert the following code right above it (actually, inserting it at any location in the head-section, i.e. between <head> and </head> is fine)
 
<!--GOOGLE MAPS START-->
<script src='http://maps.googleapis.com/maps/api/js'>
</script>

<script>
var basel=new google.maps.LatLng(47.558596, 7.585952);
function initialize()
{
var mapProp = {
  center:basel,
  zoom:12,
  mapTypeId:google.maps.MapTypeId.ROADMAP
  };
  
var map = new google.maps.Map(document.getElementById("googleMap"),mapProp);

var myCity = new google.maps.Circle({
  center:basel,
  radius:500,
  strokeColor:"#0F915B",
  strokeOpacity:0.8,
  strokeWeight:2,
  fillColor:"#13CA7E",
  fillOpacity:0.4
  });

myCity.setMap(map);
}

google.maps.event.addDomListener(window, 'load', initialize);
</script>
<!--GOOGLE MAPS END-->

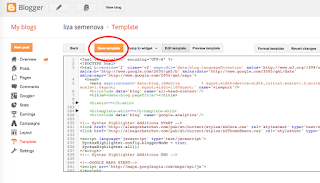
Step Quatro). Press the 'Save Template' button


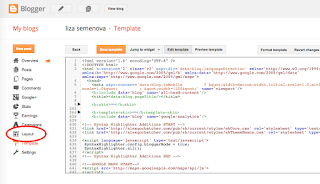
Step Cinque). Navigate to 'Layout'


Step Sei). Chose, in which section you would like to add the map. And insert the following code there:
 
<div id="googleMap" style="height:200px;border-width:5px;border-style:outset;">
</div>
This is it. Enjoy!

P.S. The most straightforward link to check the details of Google Maps Javascript API is here.

Thursday 4 February 2016

Maps and mapping: then and now.

Geographical discoveries, finding the shortest route to the supermarket, navigating through traffic jams, heat maps of a tornado intensity, mining, military attacks  - all of that is barely possible without maps.

When I was little, maps were used instead of tapestry in my parents and grandparents homes - from modern political and geographical maps to the the map of ancient Russia with its trade trails and neighboring folks. It is hard to believe, how limited out ability to precisely document geographical locations was until recent. For instance, a book with historical maps of Switzerland that one of my friends owns, starts with an upside-down map (the north-south direction is inverted) where distances correspond to some severely skewed metric. The first adequate map of the country was made by a (bored?) Swiss army soldier quite late in the country's history.

Today, on the contrary, through a digital device anyone has access to abundant spatial information. The GPS (Global Positioning System) assigns precise coordinates to any point on Earth. This allows us to store raster images coming from satellites, air-borne devices, infra-red cameras and, lately, drones to later retrieve the data.

A funny fact is that for many people a map has become a synonym of the google maps product. Furthermore, with a bit understanding of HTML and JavaScript (can be substituted with the accurate copy-paste ability) such a map can be incorporated in any webpage. Technical details follow in the next post.

Due to advances of modern technology we don't even notice how we start co-creating maps by feeding bits of our private information into geographical information systems. We overlay our pictures, trajectories, life events. And so we moved from the static world of paper based maps to the dynamic world of synergetical co-mapping.

Another personal remark: maps and mapping is not just something that I find entertaining, but it is interweaved with  my PhD project. Isn't it a great application of the spatial science: risk mapping of infectious diseases? It constitutes an immanent part of the understanding of the phenomena. During a pandemic such as, for instance, the ongoing spread of the Zika virus, the first question to be addressed is 'Where?'. Followed by 'How many?' and 'What is next?'. 

Therefore, not unexpectedly, once this blog was called to life, I felt an urge of amending it with a map. Right at the top. And geo-tag along with the blogging process the places I am writing about.

If you own a webpage that needs a google map to be incorporated, you may find the next post useful. And if you don't, let me know which information is missing.

To wrap-up, here is another map in case you are curious about history: BBC: World War, Western Front.

Monday 1 February 2016

The pavement test

Exactly two years ago I realised, what the ultimate check for my Acroyoga skills was: together with an Acroyoga teacher from Basel we were promoting a yoga project that was about to begin. For this we went to one of Basel's main squares and performed couple of Acroyoga moves. Without thinking for too long we agreed on 'two high': one person (flyer=me) standing on the shoulders of another person (base=him). And there was nothing special in this structure for my psychology at that point anymore except for the fact, that instead of friendly soft mats of a yoga studio or grass in the park, this action was taking place on the pavement... Nothing went wrong that day. Never the less, I was dreaming of falling the whole consequent night.

Time was passing by and the term 'Acroyoga' was updated with 'Acrobatics' in my vocabulary, which was reflecting the changes of our practice. By 'us' I mean here a group of friends, training together, the 'Team Basel' - a handful of enthusiasts, without whom my present life would not have the acrobatic flavour.

Last summer we were substantially exposed to standing acrobatics. Even I, personally, revised those tricks only couple of times - mostly on Acrobatics conventions and workshops - time to rewind came on the last weekend of January, when one of our travelling teachers turned out to be in town. On a cold, rainy, windy day we headed for a photoshoot towards one of the most strange man-made constructions I have ever seen: the Messe (which means 'the Fair' in german). Thanks goodness, Tari (the teacher) is such a precise and experienced balance worker, that he could compensate all my beginner's mistakes and make me land  back on my feet as a feather.

Yet, my second pavement experience!

x
A photo posted by Elizaveta Semenova (@farbless) on